+44 (0) 845 9000 601
Contact our technical sales team now to discuss your requirements

£0.00
You have no items in your shopping cart.
Click basket to edit.
Contact our technical sales team now to discuss your requirements

£0.00
You have no items in your shopping cart.
Click basket to edit.

Data from the GRD GPRS and ERD Ethernet units can be viewed on the M2M web interface in chart, table and graphical format. The data can also be downloaded as a CSV file. The web interface provides a data panel where customers can view a customised web interface showing data from all their remote locations. The channel scaling, reports, alarm levels, and alarm recipients are set from our web control page removing the need to dial up units or visit sites for reprogramming.
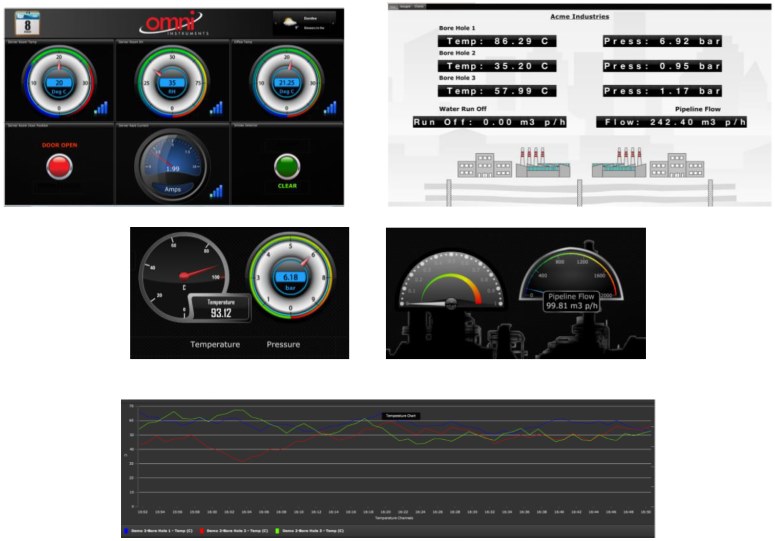
The M2M website can be accessed on the following link http://m-2-m.com/. The first page you will find is the main M2M message board, which contains any updates on the service and links to further information including the user guide, T's&C's and a link to the M2M interface. The M2M home page includes a link to an M2M Demonstration page, on which you will see a graphical display showing some sample data, which will update every 10 mins and may some readings may go into alarm. The graphical display can be customised to your specification with different back grounds, gauges, text effects and more. Here are a few examples of the displays than can be created:
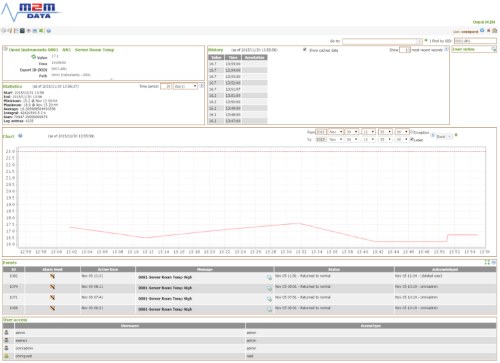
The Data Points page shows details of the data from each channel of the data logger. The details include the latest reading details, statistics and recent history over a selectable time period. The page also shows a graph with the ability to select the time period displayed as well as the ability to download the historical data to CSV or Excel formats. This page will also display recent alarms and the users that have access to the data point.
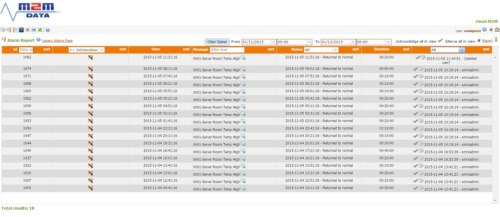
The Alarms page will provide details of any active alarms and give the ability to search for previous alarms. You will be able to acknowledge the alarms and see the duration of the alarms as well as which user has acknowledged the alarms.
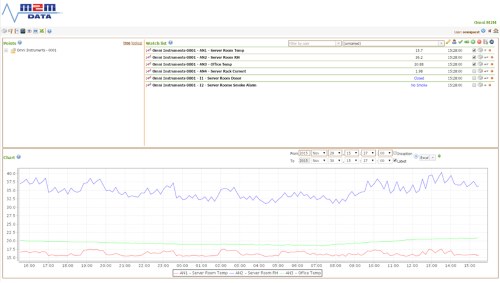
The Watch List page gives the ability to see several data points simultaneously to give an overall system picture. This page also provides a graph that can have several data points charted simultaneously for data comparison.
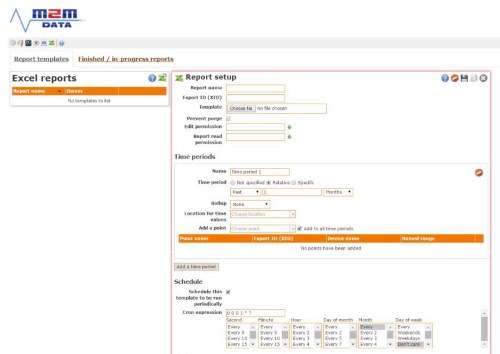
The Excel Reports page allows the user to create, schedule and send customised reports from the M2M system. You can regularly send the historical data or other system information to an email address.
Our pricing structure is below, for additional quantities and volume applications please contact our sales team.
There are no products matching the selection.