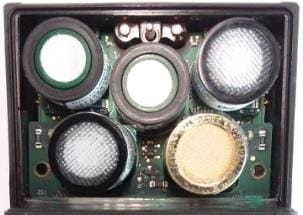
Description
Nitrogen Dioxide (NO2) is a reddish-brown gas with a sharp, pungent, and biting odour. It is one of the most significant air pollutants among the nitrogen oxides (NOx). Unlike Nitric Oxide (NO), which readily oxidizes to form NO2, nitrogen dioxide is directly a highly toxic gas and a strong oxidizing agent.
Key Properties:
- Colour: Reddish-brown (can appear as a hazy brown cloud at higher concentrations).
- Odour: Sharp, pungent, biting; detectable at low concentrations, but prolonged exposure can lead to olfactory fatigue.
- Highly Toxic: A potent respiratory irritant that can cause immediate and delayed health effects.
- Density: Heavier than air, so it tends to accumulate in low-lying areas, trenches, and confined spaces.
- Reactive: Plays a major role in atmospheric chemistry, contributing to the formation of ozone and particulate matter.
Replacement Sensor, Part No. 17124975-4, Properties
| Gas Detected (Abbreviation) |
Sensor Type | Measurement | Response time (Seconds) |
Calibration Gas & Concentration |
||
|---|---|---|---|---|---|---|
| Range | Resolution | T50 | T90 | |||
| Nitrogen Dioxide NO2 |
Electrochemical | 0 to 150ppm | 0.1ppm | 7 | 18 | NO2 25 ppm |
Toxic Gas Sensor Cross-sensitivity Table
| Target Gas | Sensor | ||||||||||||
|---|---|---|---|---|---|---|---|---|---|---|---|---|---|
| CO | CO (H2 Low) |
H2S | SO2 | NO2 | Cl2 | ClO2 | HCN | HCl | PH3 | NO | H2 | NH3 | |
| CO | 100 | 100 | 1 | 1 | 0 | 0 | 0 | 0 | 0 | 0 | 0 | 20 | 0 |
| H2S | 5 | 5 | 100 | 1 | -40 | -3 | -25 | 10 | 300 | 25 | 10 | 20 | 25 |
| SO2 | 0 | 5 | 5 | 100 | 0 | 0 | 0 | – | 40 | – | 0 | 0 | -40 |
| NO2 | -5 | 5 | -25 | -165 | 100 | 45 | – | -70 | – | – | 30 | 0 | -10 |
| Cl2 | -10 | 0 | -20 | -25 | 10 | 100 | 60 | -20 | 6 | -20 | 0 | 0 | -50 |
| ClO2 | – | – | – | – | 20 | 100 | – | – | – | – | – | – | – |
| HCN | 15 | – | – | 50 | 1 | 0 | 0 | 100 | 35 | 1 | 0 | 30 | 5 |
| HCl | 3 | – | – | 5 | 0 | 2 | 0 | 0 | 100 | 0 | 15 | 0 | 0 |
| PH3 | – | – | – | – | – | – | -100 | 425 | 300 | 100 | – | – | – |
| NO | 25 | 40 | -0.2 | 1 | 5 | – | – | -5 | – | – | 100 | 30 | 0 |
| H2 | 22 | 3 | 0.08 | 0.5 | 0 | 0 | 0 | 0 | 0 | 0 | 0 | 100 | 0 |
| NH3 | 0 | 0 | 0 | 0 | 0 | 0 | 0 | 0 | 0 | 0 | 0 | 0 | 100 |
The table above reflects the percentage response provided by the sensor (top row) when exposed to a known concentration of the target gas (column 1).
The numbers were measured under these environmental conditions: 20 °C (68 °F), 50% RH and 1 atm.
The specified cross-interference numbers apply to new sensors only and may vary with time as well as from sensor to sensor.
“-” means no data available.
This table is given as a reference only and is subject to change.


