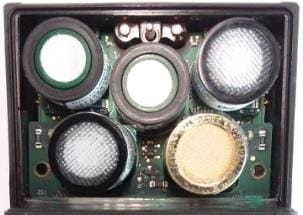
Description
Phosphine (PH3) is a colourless, highly toxic, flammable gas with a distinctive odour that is often described as resembling garlic or rotting fish. It is an extremely dangerous gas due to its toxicity, even at very low concentrations.
Key Properties:
- Colourless: Invisible to the naked eye.
- Odour: Characteristic garlic or rotting fish smell. This odour can be a warning, but at high concentrations, it may not be detectable or may cause olfactory fatigue.
- Highly Toxic: Even very small amounts can be lethal. It primarily targets the cardiovascular and respiratory systems.
- Flammable/Explosive: Phosphine is pyrophoric, meaning it can spontaneously ignite in air at room temperature. It also forms explosive mixtures with air. Impurities like diphosphine (P2H4) often cause this spontaneous flammability.
- Density: Slightly heavier than air, so it can accumulate in low-lying areas or confined spaces.
Replacement Sensor, Part No. 17124975-9, Properties
| Gas Detected (Abbreviation) |
Sensor Type | Measurement | Response time (Seconds) |
Calibration Gas & Concentration |
||
|---|---|---|---|---|---|---|
| Range | Resolution | T50 | T90 | |||
| Phosphine Low (PH3) |
Electrochemical | 0 to 5 ppm | 0.01ppm | 5 | 18 | PH3 1 ppm |
Toxic Gas Sensor Cross-sensitivity Table
| Target Gas | Sensor | ||||||||||||
|---|---|---|---|---|---|---|---|---|---|---|---|---|---|
| CO | CO (H2 Low) |
H2S | SO2 | NO2 | Cl2 | ClO2 | HCN | HCl | PH3 | NO | H2 | NH3 | |
| CO | 100 | 100 | 1 | 1 | 0 | 0 | 0 | 0 | 0 | 0 | 0 | 20 | 0 |
| H2S | 5 | 5 | 100 | 1 | -40 | -3 | -25 | 10 | 300 | 25 | 10 | 20 | 25 |
| SO2 | 0 | 5 | 5 | 100 | 0 | 0 | 0 | – | 40 | – | 0 | 0 | -40 |
| NO2 | -5 | 5 | -25 | -165 | 100 | 45 | – | -70 | – | – | 30 | 0 | -10 |
| Cl2 | -10 | 0 | -20 | -25 | 10 | 100 | 60 | -20 | 6 | -20 | 0 | 0 | -50 |
| ClO2 | – | – | – | – | 20 | 100 | – | – | – | – | – | – | – |
| HCN | 15 | – | – | 50 | 1 | 0 | 0 | 100 | 35 | 1 | 0 | 30 | 5 |
| HCl | 3 | – | – | 5 | 0 | 2 | 0 | 0 | 100 | 0 | 15 | 0 | 0 |
| PH3 | – | – | – | – | – | – | -100 | 425 | 300 | 100 | – | – | – |
| NO | 25 | 40 | -0.2 | 1 | 5 | – | – | -5 | – | – | 100 | 30 | 0 |
| H2 | 22 | 3 | 0.08 | 0.5 | 0 | 0 | 0 | 0 | 0 | 0 | 0 | 100 | 0 |
| NH3 | 0 | 0 | 0 | 0 | 0 | 0 | 0 | 0 | 0 | 0 | 0 | 0 | 100 |
The table above reflects the percentage response provided by the sensor (top row) when exposed to a known concentration of the target gas (column 1).
The numbers were measured under these environmental conditions: 20 °C (68 °F), 50% RH and 1 atm.
The specified cross-interference numbers apply to new sensors only and may vary with time as well as from sensor to sensor.
“-” means no data available.
This table is given as a reference only and is subject to change.


